

Reporting built for real business operations
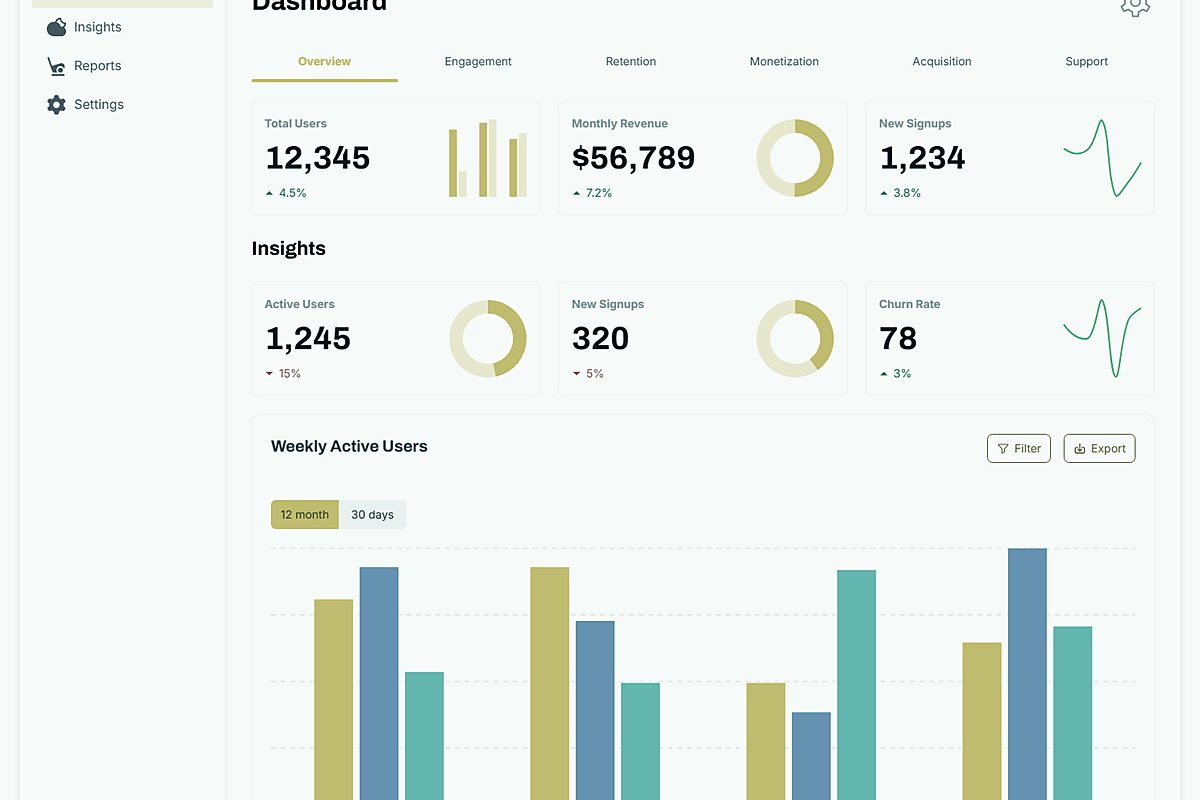
Exiqze reporting is designed for companies that need more than headline dashboards. It brings together financial data, sales activity, product performance, and operational metrics from across the platform into views your team can actually use.
With role-based dashboards, custom reports, and data access across 440 API endpoints, teams can explore live metrics, compare periods, and export the information needed for management, finance, and operations.
Gain clearer visibility, act earlier, and keep decisions tied to live platform data.
See FeaturesExplore performance through live charts and drill-down views
Move from summary metrics to detailed analysis without leaving the reporting workspace.Live KPI Visualizations
Track sales, revenue, orders, subscriptions, or operational metrics through charts that reflect current platform activity.
Transaction-Level Drill-Down
Open the underlying records behind totals so teams can inspect invoices, products, orders, or other source data.
Role-Based Views
Show finance, management, sales, or operations teams the metrics most relevant to their responsibilities.
Custom reporting and detailed analysis
Build reports around your actual workflows
Configure reports around the business questions you need answered, not around fixed templates.
Custom Filters and Fields
Choose the fields, filters, and layouts that match the way your team reviews sales, finance, stock, or service performance.
Export and Share
Export reports for management reviews, accounting checks, stakeholder updates, or offline analysis.
Detailed Trend Analysis
Compare periods, categories, products, or clients to understand where performance is improving or slipping.
Live Reporting
Review current business activity as data changes across the platform, including orders, invoices, and operational events.
Segmented Analysis
Break down results by customer group, product line, location, site, or other business dimensions tracked in Exiqze.
Platform and API Integration
Combine data from core Exiqze modules and external systems through APIs and webhooks when broader reporting is required.
Predictive Analytics & Trend Forecasting
Use historical platform data to model likely demand, revenue, and operational shifts so teams can plan with better context rather than react late.
- Identify patterns in sales, customer activity, and operational throughput
- Forecast likely demand and support planning for stock, staffing, or campaign timing
- Compare likely outcomes before committing to pricing, staffing, or budget changes
Real-Time Alerts & Anomaly Detection
Monitor key metrics and highlight unusual movement so teams can respond quickly when revenue, activity, or process performance changes unexpectedly.
- Detect unusual movements in operational or financial data that deserve review
- Send alerts through dashboards or connected communication workflows
- Define thresholds that reflect your own operational and financial tolerances
Integration with External Data Sources
Extend reporting with external systems when your operation requires data beyond the native Exiqze modules.

440 API Endpoints and Webhooks
Connect reporting workflows to external tools with Exiqze's 440 REST endpoints and webhook support.

Scheduled Data Sync
Refresh external reporting inputs on a defined schedule so dashboards stay current without manual imports.

CRM, Commerce, and Finance Data
Bring together CRM activity, eCommerce performance, invoicing, and other business data for wider reporting coverage.
AI-assisted recommendations
Move from observation to action faster. Exiqze can surface AI-assisted recommendations from platform data so teams see where attention is most likely needed next.
Prioritized Actions
Highlight the issues or opportunities most likely to affect performance.
Context-Aware Suggestions
Show recommendations based on current business conditions and the underlying records behind them.
Decision Support
Use reporting outputs to support concrete next steps, not just passive monitoring.
Scenario Planning & What-If Analysis
Test likely outcomes before changing budgets, staffing, or campaign priorities.
Adjust Variables
Best-Case
Most Likely
Worst-Case
Use Cases
- Forecast the financial effect of pricing changes
- Model how staffing changes may affect delivery capacity
- Compare marketing spend with expected conversion impact
Data Modeling & Transformation
Prepare structured reporting logic that makes data more consistent and useful across teams.
Custom Calculated Fields
Define KPIs and computed values that reflect the way your business measures success.
Data Normalization
Standardize values such as currencies, categories, or date formats before analysis.
Reporting Structure Control
Control joins, grouping logic, and segmentation rules for deeper reporting work.
Data governance and accountability
Keep reporting access controlled and traceable across the platform.
Reporting often includes sensitive operational and financial information, so governance needs to be explicit.
- Role-based permissions: Restrict access to specific reports, datasets, or actions.
- Audit logging: Track report generation, access, and important changes.
- Historical tracking: Preserve reporting structure and prior outputs where your process requires it.

Triggered Reports & Alert-Based Delivery
Deliver reports automatically when the right conditions are met instead of relying on manual exports.
Threshold-Based Alerts
Notify the right stakeholders when tracked metrics move outside expected ranges.
Conditional Scheduling
Send reports only when specific business rules or thresholds are reached.
Dynamic Recipients
Route reports according to the site, tenant, team, or performance condition involved.
Supported delivery formats:
- Email exports such as PDF or spreadsheet attachments
- Connected communication channels where configured
- Secure download links
- Embedded dashboard or iframe updates